1. Overview
This page showcases my contributions to an open source software engineering group project as part of a university module. ClinicIO is a desktop application intended for medical clinic receptionists and doctors. It allows them to effortlessly manage a multitude of clinic processes such as managing queues. While there is a Graphical User Inteface (GUI) for displaying results, a key constraint for the module was to ensure that the application is used through a text interface. The program logic is written in Java in an Object Oriented manner and the GUI is written in JavaFX.
In the management of the project, I was responsible for ensuring the quality of the project’s documentation. This involved a decided focus on reviewing language, ensuring that it is in-depth and simple to understand. I believe this is important to enable our program to be adopted by users and external developers.
My individual role was as a developer in charge of managing the program’s data. To this end, I worked together with my group members to understand their features and subsequently integrated the ability to view analytics for each of them. In addition, I contributed the ability to export data out of the program.
2. Summary of contributions
This section lays out my contributions to the project.
-
Code contributed: my code
2.1 Major enhancement: the ability to view detailed statistics and visualizations.
-
What it does: It allows the user to track the activity of a clinic through objective metrics, in a simple manner. Analytics are enabled for patients, appointments and doctors.
-
Justification: This feature improves the product significantly because it provides a user with insight to make decisions regarding the clinic’s processes. This can be used to improve the efficiency and the experience for both staff and patients. It ensures that the clinic is able to improve with time, in order to benefit all stakeholders.
-
Highlights: This enhancement integrates across the major functions of a clinic. It was a challenge to design and implement a flexible yet powerful interface through which different types of visualizations can be easily created. A consistent and visually appealing graphical user interface was also a key part of this. This was done in order to ensure that many more metrics can be programmed to be tracked in the future.
The following code snippet adds a summary of statistics to be displayed:
statData.updateSummary("title goes here", "list of labels go here", "list of values go here")
-
Minor enhancement: the ability to export various types of patient data to a human editable format (CSV).
2.2 Other contributions:
-
Project management:
-
Enhancements to existing features:
-
Added the ability to switch between GUI panels on top of an existing GUI placeholder: #227
-
-
Documentation:
-
Community:
3. Contributions to the User Guide
The following are sections I contributed to the User Guide. They showcase my ability to write documentation targeting end-users . |
Data Management
Analytics
The analytics feature allows users to view statistics across the various functions of a clinic. These are viewed in isolation with separate commands for each department. However, they share a similar user interface composed of two distinct sections. They are the summary and the visualizations as shown in the following screenshot:
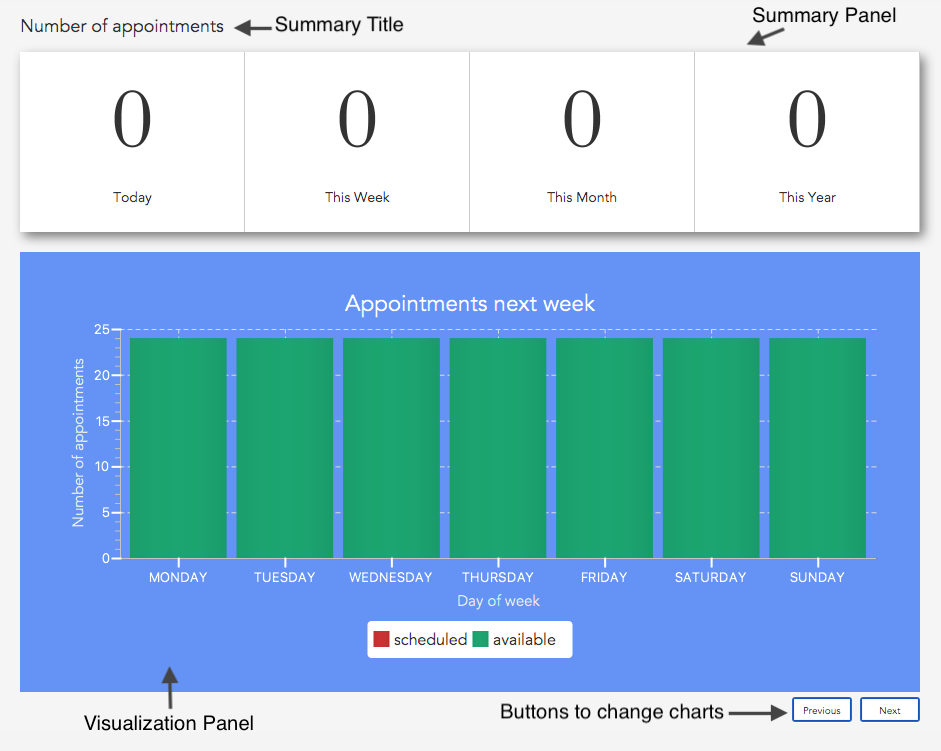
Summary
The summary displays the number of occurrences of events such as the Number of appointments in the screenshot above.
They can be raw totals or averages. This will be indicated by the title. The numbers are categorized according to the
following time periods:
-
Today: The occurrences on the present real life date. -
This Week: The occurrences in the present real life week spanning from Monday to Sunday. -
This Month: The occurrences in the present real life month. -
This Year: The occurrences in the present real life year.
Visualizations
The pane below the summary displays visualizations. There may be multiple visualizations which can be cycled through
using the Next and Previous buttons. The visualizations may be either one of a vertical bar chart, horizontal bar
chart, vertically stacked bar chart or a line chart.
Analytics Commands
The following commands can be used to display the different types of statistics.
Displaying patient statistics : patientstats
Displays the following information about patients:
Format: patientstats
Displaying appointment statistics : apptstats
Displays the following information about appointments:
Format: apptstats
Displaying doctor statistics : doctorstats
Displays the following information about doctors:
Format: doctorstats
You can view my user guide contribution towards the export feature here: exporting patient data
4. Contributions to the Developer Guide
The following below are sections I contributed to the Developer Guide. They showcase my ability to write technical documentation and the technical depth of my contributions to the project. |
Analytics feature
Implementation
The following class diagram represents the relationships between classes in the analytics package.

The abstract Statistics class specifies methods for the computation and retrieval of two groups of statistics. The
first group consists of statistics to be displayed as a summary while the second is for ones that are visualized. Each
of the statistics classes inherit from Statistics. They are encapsulated in Analytics which acts as a
wrapper class for the various statistics and employs the delegation pattern. Each of the statistics classes may depend
on`DateUtil` and TimeUtil. These classes contain utility methods for date and time information such as the number of
occurrences in a certain date or time period. The occurrences can be of events such as appointments.
Data Management
Each of the statistics classes depend on the following classes for storing data:
-
StatData:-
acts as a structure to encapsulate all statistics data to be displayed for simpler transport from
AnalyticstoAnalyticsDisplay. -
contains
SummaryDataandCircularListobjects. The latter storesVisualizationDataobjects. -
interfaces directly with the statistics classes to receive data.
-
used by
AnalyticsDisplayto obtain fields required to create summary and visualizations.
-
-
SummaryData:-
acts as a structure to encapsulate information required to create summaries.
-
contains the following fields:
-
title: the title of the summary information. -
summaryElements: the texts and their accompanying values.
-
-
-
CircularList:-
used for storing
VisualizationDataobjects. Allows visualizations to be cycled backwards and forwards on the user interface.
-
-
VisualizationData:-
acts a structure to encapsulate information required to create visualizations.
-
contains the following fields:
-
id: the id of the chart. Used as an identifier to apply Cascading Style Sheet (CSS) to style each chart individually. -
type: the type of the chart. May be either one of a vertical bar chart, horizontal bar chart, vertically stacked bar chart or a line chart. -
isContinuous: indicates if the chart is continuous or categorical. Used byPlotto create the appropriate chart. -
chartTitle: the title of the chart. -
xTitle: the title of the horizontal axis if the chart is vertical or the vertical axis if horizontal. -
yTitle: the title of the vertical axis if the chart is vertical or the horizontal axis if horizontal. -
dataGroups: the groups of data points to be plotted. Must be the same in number asdataGroupsLabels. -
dataGroupsLabels: the label for each group of data. Used in the legend of the chart. Must be the same in number asdataGroups.
-
-
-
Tuple:-
used to store pairs of values as a convenient means by which to transport data points.
-
used mostly within a
List, allowing order to be preserved.
-
Processes
This section describes the processes that take place in order to display analytics.
All Statistics Commands
The following apply to all the different types of statistics:
-
Analyticsupdates the appropriate statistics object with the latest appropriate lists (e.g. appointments) fromModelManager. -
The particular statistics object then calculates the summary for the various time periods mentioned above.
-
The particular statistics object then calculates data for one or more visualizations and updates
StatData. -
AnalyticsretrievesStatDatafrom the statistics object and passes it toModelManager. -
ModelManagerraises anAnalyticsDisplayEventcontainingStatData. -
AnalyticsDisplayretrievesStatDatafromAnalyticsDisplayEventand passes it toAnalyticsPlot. -
AnalyticsPlotupdates the summary user interface. -
AnalyticsPlotdecides and plots the appropriate chart on the user interface.
patientstats Command
The following are the processes performed specifically by PatientStatistics:
-
PatientStatisticscalculates the summary of the number of patients. -
PatientStatisticscalculates the number of patients for the following time periods in a day:-
9AM - 12PM,12PM - 3PM,3PM - 6PM,6PM -9PM
-
-
PatientStatisticsupdatesStatDatawith this data for a vertical bar chart visualization. -
PatientStatisticscalculates the total historical number of patients for each day in a week. -
PatientStatisticsupdatesStatDatawith this data for a vertical bar chart visualization.
apptstats Command
| By default, 24 appointment slots are available in day. |
The following are the processes performed specifically by AppointmentStatistics:
-
AppointmentStatisticscalculates the summary of the number of appointments. -
AppointmentStatisticscalculates the number of scheduled and available appointment slots for each day of the following week. -
AppointmentStatisticsupdatesStatDataobject with this data for a stacked bar chart visualization. -
AppointmentStatisticscalculates the number of scheduled appointments for each date in the current year. -
AppointmentStatisticsupdatesStatDataobject with this data for a line chart visualization.
doctorstats Command
The following are the processes performed specifically by DoctorStatistics:
-
DoctorStatisticscalculates the summary of the average number of consultations per doctor. -
DoctorStatisticscalculates the number of patients who prefer each doctor. -
DoctorStatisticsupdatesStatDataobject with data for a horizontal bar chart visualization.
Design Considerations
Aspect: Computing statistics
-
Alternative 1 (current choice): Compute statistics only upon request
-
Pro: This reduces unnecessary computational workload.
-
Con: There is greater computational workload upon request of the statistics which may result in the user having to wait longer (if at all) to view them.
-
-
Alternative 2: Compute statistics every time there is a change in the underlying data
-
Pro: There is no chance of the user having to wait to view statistics.
-
Con: This increases the computational workload which may provide little benefit if statistics are not viewed frequently by the user.
-
Aspect: User interface for the different types of statistics
-
Alternative 1 (current choice): Single, predetermined user interface
-
Pros: It is consistent, making it easier for users to process the information. It easier to implement due to the reusability of code.
-
Con: It lowers flexibility by mandating all statistics types to only have a summary and visualization component.
-
-
Alternative 2: Customized user interface for each type of statistic
-
Pro: It allows displays of quantitative information that are better suited for each individual statistics type. This results in greater flexibility even in the future as users may have changing analytics needs.
-
Cons: It may lower design consistency, forcing users to readjust each time they view it. It is more difficult to implement.
-
-
Alternative 3: Allow users to pick and choose which statistics they want to view.
-
Pro: This provides the greatest flexibility as users have total control in which statistics they view.
-
Cons: The burden is placed on the user having to decide which statistics they want to view. It is more difficult to implement as a consistent user interface needs to be designed to accomodate all the possible combinations.
-
Export feature
The export feature allows users to extract patient related data out of the program, into Comma Separated Values(CSV) format.
Current Implementation
The following swimlane diagram represents the workflow of the export functionality.

The ExportPatientData class contains static methods for filtering and organizing the relevant data. These methods
depend on a list of patients. It then passes the data to ExportUtil in order to write to a CSV file. ExportUtil also
checks the validity of the data to be written. The names and locations of the CSV files are predetermined by
ExportPatientData. All exported files are stored in the root folder of the program.
The following operations are implemented:
-
exportpatientsCommand - exports all patients' personal information intoClinicIO_patientdata.csv. -
exportpatientsappointmentsCommand - exports all patients' appointment records intoClinicIO_patientsappointments .csv. -
exportpatientsconsultationsCommand - exports all patients' consultation records intoClinicIO_patientsconsultations.csv.
Design Considerations
Aspect: File format
-
Alternative 1 (current choice): CSV
-
Pros: It is human editable and has a simple schema, making it easier to understand. It is supported on all target platforms. Additionally, it is easier to implement.
-
Con: It does not allow complex relationships. This may result in repetitive data.
-
-
Alternative 2: XLS (Native Excel format)
-
Pros: It allows more complex relationships between data to be stored. Data can also be stored in the form of charts and graphs.
-
Cons: It is less widely supported and consumes more memory. It is also more difficult to implement.
-
Aspect: File location and naming
-
Alternative 1 (current choice): File location and naming are predetermined within the program and they are to be stored in the root folder.
-
Pros: Users can easily find it as it is in the same location as the program and has a standard name. It also results in a quicker operation and is easier to implement.
-
Con: It reduces flexibility as another step is required if the user needs it in another directory.
-
-
Alternative 2: File location and naming are specifiable by user.
-
Pro: This would give users more control.
-
Cons: It results in a slower operation due to the time taken to enter filename and location. It is also more difficult to implement.
-